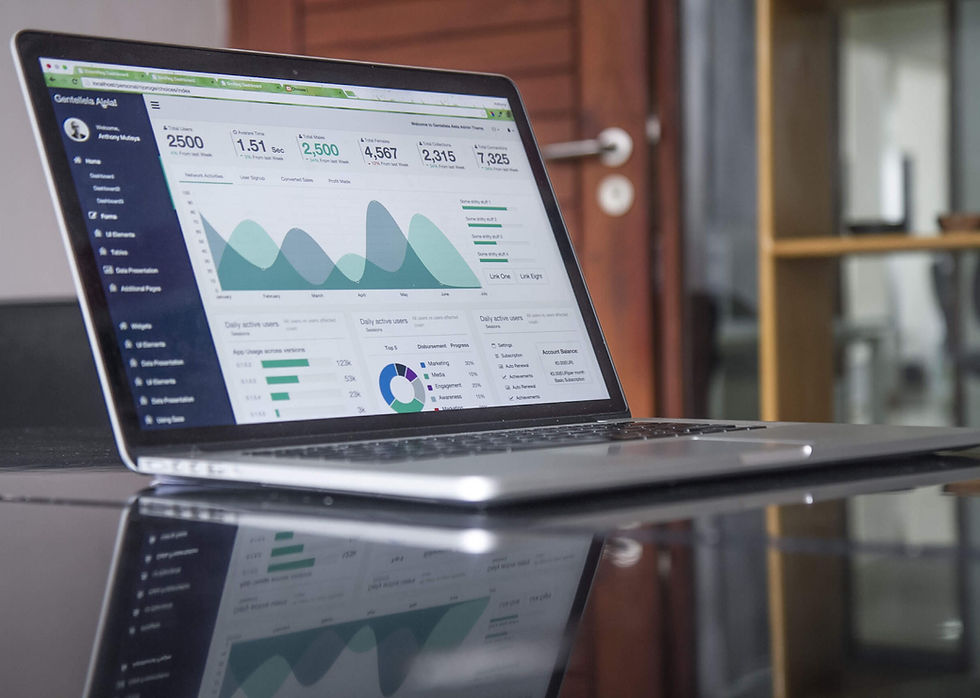
Your Dashboard Isn’t the Star: Your Data Is
- thomasmonteith
- Jun 19
- 2 min read
Updated: Jul 2
We’ve all seen them: stunning dashboards with animated charts, glowing KPIs, and interactive filters. They look impressive, but do they tell the truth?
Here’s the reality: a visual is only as powerful as the data behind it. If that data is outdated, inaccurate, or incomplete, the dashboard becomes a digital mirage, pretty to look at, but leading you nowhere.
The real strategic advantage comes from what lies beneath the surface: trusted, governed, and accessible data. Get that right, and your visuals won’t just look good; they’ll work. They’ll inform smarter decisions, reveal hidden risks, and drive real outcomes.

The Strategic Core: Data and Information
Today’s most competitive businesses have one thing in common, they don’t just collect data: they understand it, trust it, and use it to drive action.
Data, when transformed into meaningful information, becomes the foundation for:
Smarter decision-making
Faster time-to-insight
More effective customer engagement
Operational efficiency
Risk mitigation
This isn't just theory. Companies that invest in data quality, governance, and analytics capabilities consistently outperform those that don’t. Why? Because they’re not reacting blindly, they’re responding with clarity and confidence.
So What Happens When the Data Is Weak?
Even with the best visualization tools, weak data means:
Misleading trends
Incorrect assumptions
Wasted time chasing down errors
Poor decisions that ripple across departments
And worst of all? Loss of trust in the tools, in the reports, and ultimately in the data itself.
Turning Data Into Competitive Advantage
To unlock strategic value, organizations must look beneath the surface of visuals and ask tough questions:
Where is this data coming from?
Is it clean, timely, and consistent?
Are we capturing the full story (structured and unstructured data alike)?
Is everyone working from the same version of the truth?
That’s where a well-executed data strategy comes in. It's about creating a reliable, governed environment where insights can be surfaced with confidence. Whether it's through a visual, a report, or a AI-powered tool.
Final Thought: Pretty Charts Don’t Drive Strategy, Trusted Information Does
Yes, visuals matter. They bring clarity, highlight trends, and tell stories. But if the underlying data is broken, incomplete, or siloed, the story they tell could lead you in the wrong direction.
Want to build visuals that actually move your business forward? Start with the data. Build your foundation. Then design with confidence.
Contact Us Today! wecanhelp@etiventure.com


